NGP Inc.
12778 rue Clearview
Pierrefonds Quebec H9A1B5
(514)999-2008
support@ngpeng.com
Real time analytes monitoring
NGP Inc. proprietrary method for real time monitoring of analytes named differential swept wavelength absorption spectroscopy, or DSWAS is covered by the U.S. Patent No. 9,784,674 B2 and by the Canadian Patent No. CA2904850C
iGASTRAX is the instrument for real time monitoring of ammonia (NH3) in residual water (Fig. A01 ) using DSWAS.

A short description of DSWAS is given below. The reader is strongly recommended to read the patents for better understanding of DSWAS. The description covers the partcular case of the absorption line of ammonia at 1512nm, where there are available tunable DFB lasers from multiple manufacturers. DSWAS can be used for any analyte, preferaby in the gas phase. In certain conditions, the analyte can be dissolved into a liquid which does not make a chemical combination with it.
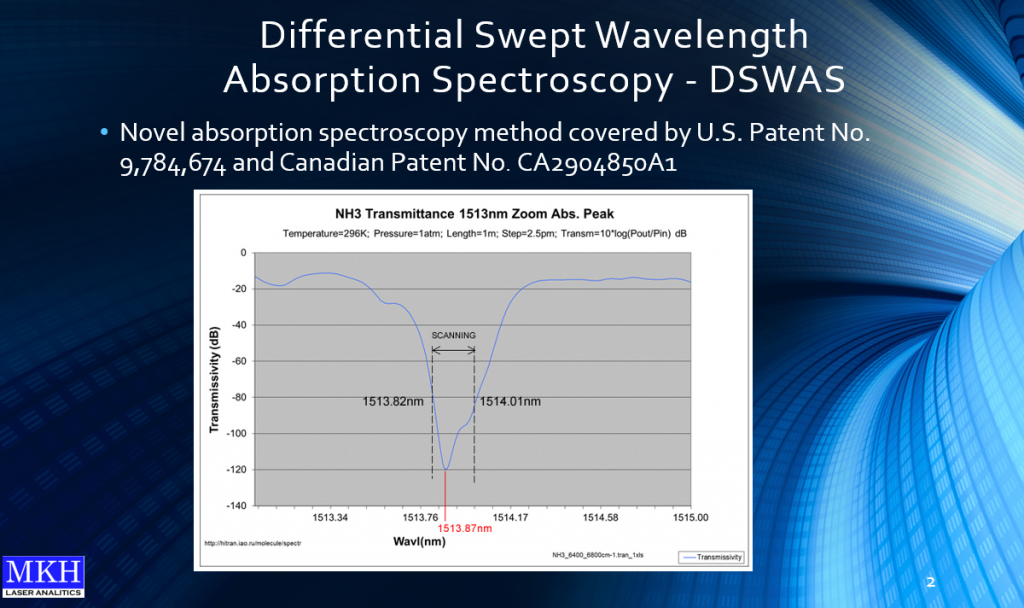
Fig. A02 shows the absorption peak or the transmission dip of NH3 at 1512nm, as provided by the reference shown on the picture. Notice that the any absorption peak is a matter property. Different measuring instruments can show slightly different wavelength values for the same absorption peak. According to DSWAS, the wavelength of the tunable laser is swept across a narrow wavlength interval i.e. 0.19nm (Fig. A02) containing the selected absorption peak for finding the maximum absorption, or the minimum transmission.
The output beam of the tunable DFB laser is split in two beams. One beam goes through the sampling cell containing the ammonia (Fig. A02). The absorption on peak (Fig. A02) is always subject to ammonia concentration. More concentration has more absorption and vice-versa. After calibration, the absorption on peak is a measure of concentration, if the power at the cell input is known. TAP beam does not go through the cell cotaining the analyte and there is no absorption at 1512nm. TAP power is always about 1% of the power at the cell input. The wavelength sweep is done by linear change of the bias current which also changes the power at the cell input. By definition, the absorption inside the cell is the ratio between the power at the cell output and the power at the cell input.
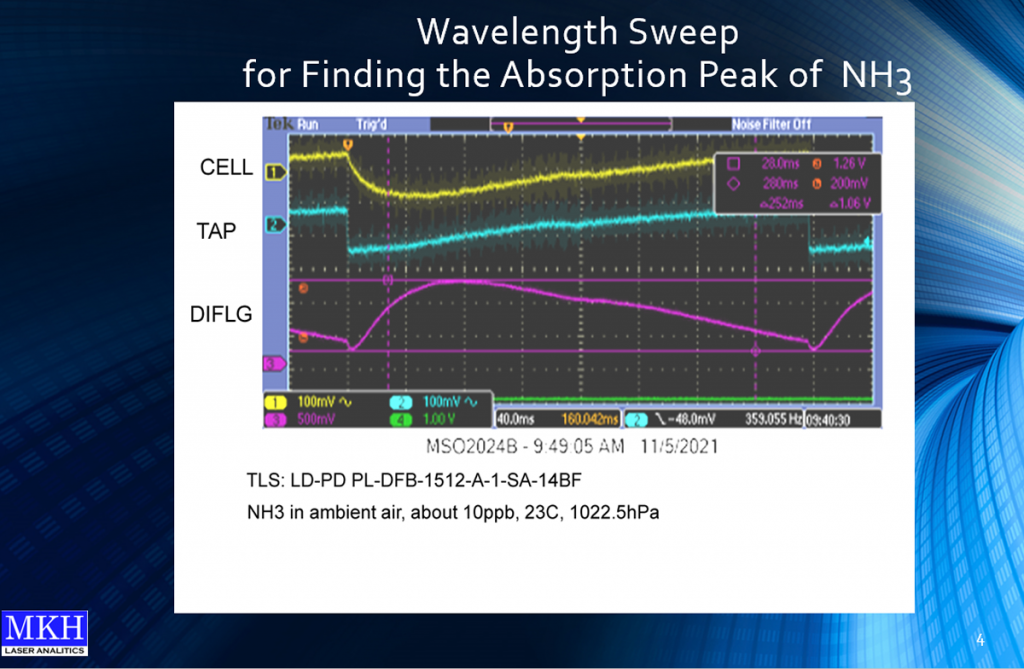
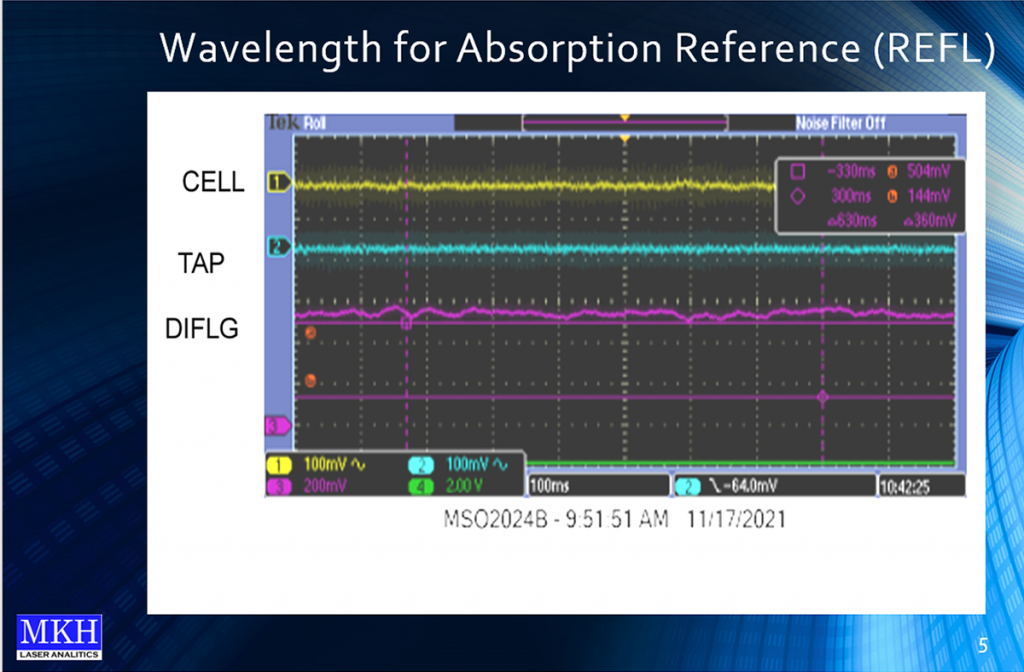
The photo detected signal at the output of the sampling cell has its minimum at resonance i.e. 1512nm (Fig. A03, CELL trace) assuming a constant power at the input. In DSWAS, the wavelength sweep of the tunable DFB laser is done through the linear sweep of the bias current (Fig. A03, TAP trace), which also changes the input beam power. The TAP beam is required for not violating the definition of absorption. There is a CELL photo detection channel and also the TAP photo detection channel. Both photo detection channels have logarithmic response on beam power. The difference signal DIFLG between TAP and CELL beams is the logarithm of the absorption inside the cell at any wavelength. (Fig. A03, DIFLG trace). The ratio is reversed for having maximum DIFLG at resonance with minimum noise. After calibration, maximum of DIFLG is the ammonia concentration, pending the knowledge of its baseline value, which means “zero” ammonia concentration. In DSWAS, “zero” DIFLG is given by its value measured into a spectral region where ammonia has negligible absorption, e.g. at 1600.8nm, generated by the reference laser REFL. An optical switch is used to switch the beam from the tunable DFB laser to the REFL (Fig. A04 DIFLG trace). By defining “zero” DIFLG with the REFL, can be compensated also the noise on both detection channels, the CELL and the TAP.
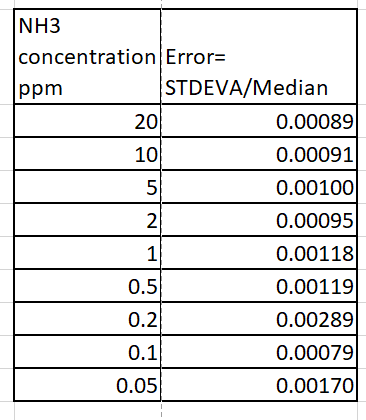
TWe define the relative measurement error, the ratio between the standard deviation and the median value of the resonant absorption. For ammonia concentration between 20ppm and 50ppb, the relative errors across 100 succesive measurements of 40ms each are below 0.3% (Fig. A05).
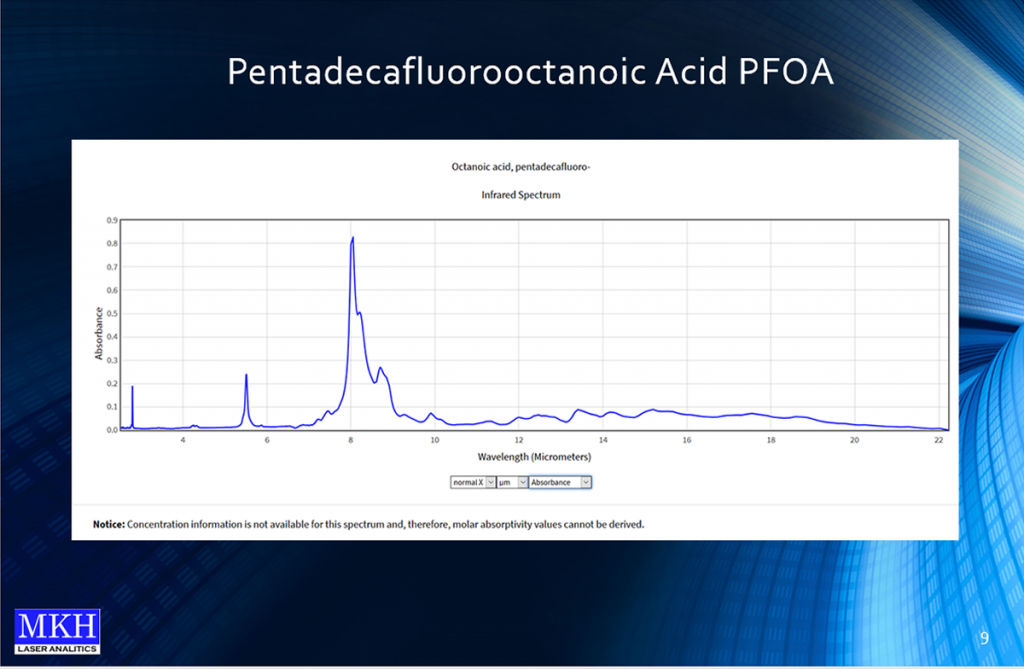
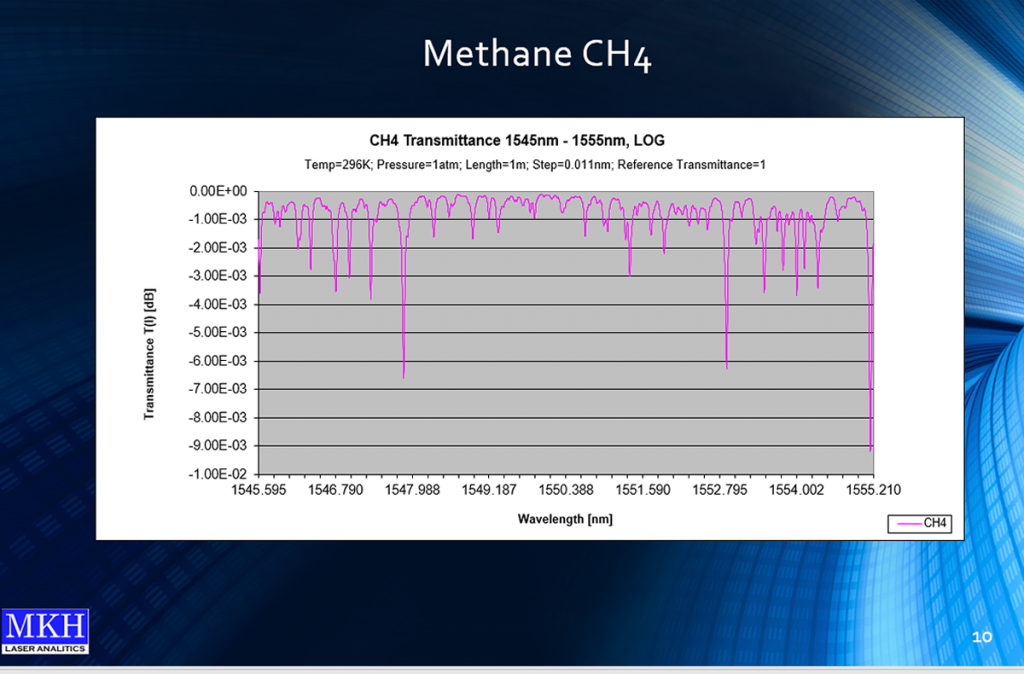
Using DSWAS, a large number of analytes can be monitored in real time, e.g. pentadecarfuorooctanoic acid – PFOA (Fig. A06), methane (Fig. A07). For each analyte, must be used the appropriate tunable laser. Using a broad tuning range laser, a single monitoring unit can monitor multiple analytes. The optics and also the photo detection channels can be specific for each wavelength range.
For more information, contact Nicolae Miron