NGP Inc.
12778 rue Clearview
Pierrefonds Quebec H9A1B5
(514)999-2008
support@ngpeng.com
Michelson Fiber Optics Sensor – MFOS
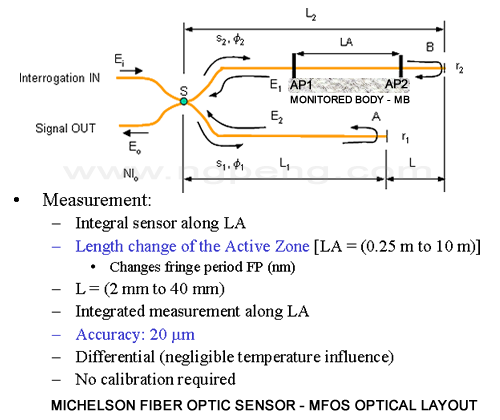
The MFOS – Optical Layout diagram shows the optical layout of Michelson interferometer built with single mode optical fibers. The reference arm on bottom side has L1 length. The measuring arm on top side has L2 length. Two anchor points AP1 and AP2 spaced by LA defining the measuring length of this sensor are rigidly attached to the monitored body MB and also to the fiber on the measuring arm. During installation, LA fiber section between the anchor points should be preloaded for allowing the measuring arm to respond to stretching and also to shrinking of the monitored body MB between AP1 and AP2. Notice that preloading of the optical fiber is possible without affecting its long term operation. The optical fiber can work reliably under constant offset load up to 12,000 micro strain. It can also be biased with 6,000 micro strain for measuring +/- 5000 micro strain variable load centered on offset load. The reference arm on bottom side must be unloaded and must be mounted close to the measuring arm for having its temperature as close as possible to the temperature of the measuring arm. LA can be set anywhere between 0.25m and 10m, as required by application. By construction, the geometric difference L=L2-L1 can be set anywhere between 2mm and 40mm, depending on the required measuring accuracy of the monitored body and on the interrogator measuring accuracy. The fringe period – FP as shown in MFOS amplitude response and PDL diagram, is used for measuring LA changes. For a given L, FP increases when LA stretches and vice versa. Measuring FP is a matter of interrogator operation. However, for avoiding measurement ambiguities, L should be always positive even for the shortest L2. This is subject of biasing LS at installation. Typical accuracy for measuring LA changes is 0.020mm for L=20mm. LA changes come from size changes of monitored body produced either by temperature variations, or by external forces applied to it. MFOS cannot make distinction between the sources of LA changes. If required, the ambiguity can be eliminated by measuring only the temperature of monitored body, using eventually a temperature fiber optic sensor.
MFOS is a differential sensor. It always responds to the optical path length difference between its two arms, which should be kept as close as possible for having the same temperature. In this case, MFOS is practically immune either to ambient temperature, or to the heat radiated by the monitored body. For finding LA changes, you are not required to measure the temperature of the monitored body. This is a tremendous advantage versus other fiber optic sensors such as FBG, where the temperature of the monitored body adds its contribution to FBG sensor response, on top of forces applied to FBG. With a single FBG sensor attached to the monitored body, FBG response comes from a combination between force and temperature of the monitored body. You need an additional FBG for temperature measurement mechanically decoupled from the monitored body. The response of temperature sensor is used for computing the dimensional change of the monitored body.
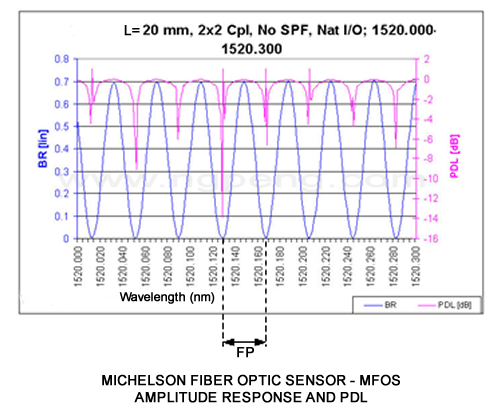
The blue graph of MFOS Amplitude Response and PDL diagram is the response of MFOS at its interrogation with sweeping wavelength laser source with <2pm bandwidth such as Tunable Fiber Optic Laser Source.
MFOS works best when interrogated with polarized laser source with constant polarization state. In real life, between interrogator and MFOS could be 10Km spacing or more. After propagation across this distance, the polarization state at the entrance of MFOS could be random, which can modulate randomly the amplitude of MFOS response. The pink graph of MFOS Amplitude Response and PDL schematic shows the polarization dependent loss – PDL of MFOS when the input laser beam goes through all possible polarization states. The large dips of the graph come from signal processing algorithms of the measuring instrument in the vicinity of fast changes of polarization states and should be ignored. The worst PDL is about -2dB, which is satisfactory for measuring FP accurately.
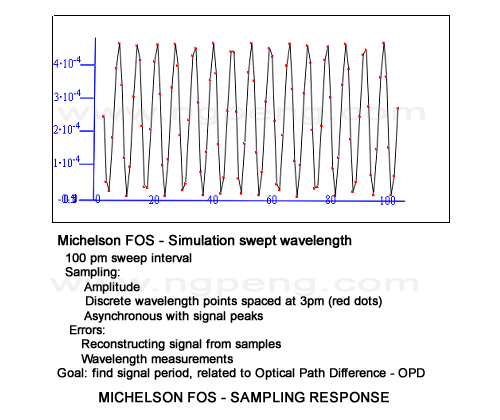
When interrogating the MFOS with a tunable laser source, the wavelength is swept continuously across the wavelength interval such as 100pm, as shown in MFOS Sampling Response diagram generated by computer simulation. The interrogator reads MFOS at regular wavelength intervals such as 3pm, shown as pink dots in the diagram. The black graph is the best fit MFOS response built from samples. Theoretically, smaller wavelength intervals sample MFOS better. Decreasing the wavelength interval below 3pm is challenging, because of the laser bandwidth. According to our measurements, our tunable fiber optic laser source peak bandwidth at 3dB is about 1.5pm; therefore, theoretically wavelength sampling interval for MFOS signal can go down to 2pm, still keeping Rayleigh peak separation approach. With 3pm step, we are on the safe side of simulation.
For additional information, contact Nicolae Miron